

Probability - Grade 10
16.1 Introduction
Very little in mathematics is truly self-contained. Many branches of mathematics
touch and
interact with one another, and the fields of probability and statistics are no
different. A basic
understanding of probability is vital in grasping basic statistics, and
probability is largely abstract
without statistics to determine the ”real world” probabilities.
Probability theory is concerned with predicting statistical outcomes. A simple
example of a
statistical outcome is observing a head or tail when tossing a coin. Another
simple example of a
statistical outcome is obtaining the numbers 1, 2, 3, 4, 5, or 6 when rolling a
die. (We say one
die, many dice.)
For a fair coin, heads should occur for 1/2 of the number of tosses and for a
fair die, each number
should occur for 1/6 of the number of rolls. Therefore, the probability of
observing a head on one
toss of a fair coin is 1/2 and that for obtaining a four on one roll of a fair
die is 1/6 .
In earlier grades, the idea has been introduced that different situations have
different probabilities
of occurring and that for many situations there are a finite number of different
possible outcomes.
In general, events from daily life can be classified as either:
• certain that they will happen; or
• certain that they will not happen; or
• uncertain.
This chapter builds on earlier work and describes how to calculate the
probability associated with
different situations, and describes how probability is used to assign a number
describing the level
of chance or the odds associated with aspects of life. The meanings of
statements like: ‘The
HIV test is 85% reliable.’ will also be explained.
16.2 Random Experiments
The term random experiment or statistical experiment is used to describe any
repeatable exper-
iment or situation, with individual experiments having one of a set of outcomes
or results. A set
of outcomes is known as an event. For example, the act of tossing a coin or
rolling a die can
be considered to be simple random experiments. With the results of either a
heads or tails or
one of {1,2,3,4,5,6} being the outcomes. These experiments are repeatable and
yield different
outcomes each time.
16.2.1 Sample Space of a Random Experiment
The set of all possible outcomes in a random experiment plays an important role
in probability
theory and is known as the sample space. The letter S is used to indicate the
sample space.
Using the terminology of set theory, the elements of S are
then the outcomes of the random
experiment. For example, when tossing a coin the sample space S is made up of {heads,tails}.
| Worked Example 72: Sample Space Question: What outcomes make up the sample space S when rolling a die. Answer Step 3 : Determine all the possible outcomes The possible outcomes when rolling a die are: 1, 2, 3, 4, 5 and 6. Step 4 : Define the sample space, S For rolling a die, the sample space is S = {1,2,3,4,5,6}. |
A set of outcomes is referred to as an event. For example,
when rolling a die the outcomes that
are an even number (i.e. {2,4,6}) would be referred to as an event. It is clear
that outcomes
and events are subsets of the sample space, S.
A Venn diagram can be used to show the relationship between the outcomes of a
random
experiment, the sample space and events associated with the outcomes. The Venn
diagram
in Figure 16.1 shows the difference between the universal set, a sample space
and events and
outcomes as subsets of the sample space.
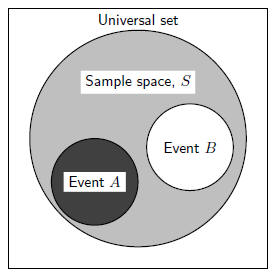
Figure 16.1: Diagram to show difference between the
universal set and the sample space. The
sample space is made up of all possible outcomes of a statistical experiment and
an event is a
subset of the sample space.
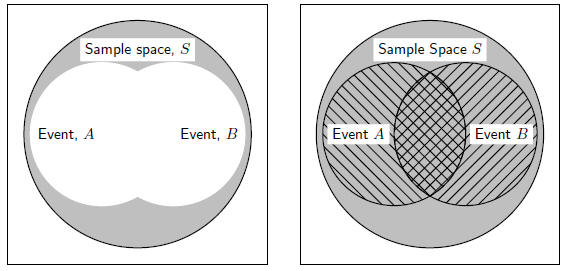
Venn diagrams can also be used to indicate the union and intersection between
events in a
sample space (Figure 16.2).
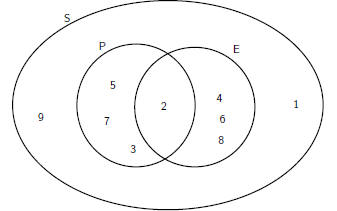
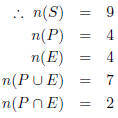
| Worked Example 73: Random Experiments Question: In a box there are pieces of paper with the numbers from 1 to 9 written on them. S = {1; 2; 3; 4; 5; 6; 7; 8; 9} Answer Step 1 : Consider the events: • Drawing a prime number; P = {2, 3, 5, 7}
Figure 16.2: Venn diagram to show (left) union of two
events, A and B, in the sample space S
Step 3 : Find the union
|
Exercise: Random Experiments
1. S = {whole numbers from 1 to 16}, X = {even numbers from 1 to 16} and
Y = {prime numbers from 1 to 16}
A Draw a Venn diagram S, X and Y .
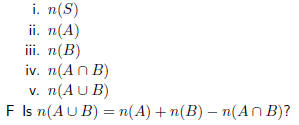
B Write down n(S), n(X), n(Y ), n(X ∪ Y ), n(X ∩ Y ).
2. There are 79 Grade 10 learners at school. All of these take either Maths,
Geography or History. The number who take Geography is 41, those who take
History is 36, and 30 take Maths. The number who take Maths and History
is 16; the number who take Geography and History is 6, and there are 8 who
take Maths only and 16 who take only History.
A Draw a Venn diagram to illustrate all this information.
B How many learners take Maths and Geography but not History?
C How many learners take Geography only?
D How many learners take all three subjects?
3. Pieces of paper labelled with the numbers 1 to 12 are placed in a box and the
box is shaken. One piece of paper is taken out and then replaced.
A What is the sample space, S?
B Write down the set A, representing the event of taking a piece of paper
labelled with a factor 12.
C Write down the set B, representing the event of taking a piece of paper
labelled with a prime number.
D Represent A, B and S by means of a Venn diagram.
E Write down
16.3 Probability Models
The word probability relates to uncertain events or knowledge, being closely
related in meaning
to likely, risky, hazardous, and doubtful. Chance, odds, and bet are other words
expressing similar
ideas.
Probability is connected with uncertainty. In any statistical experiment, the
outcomes that occur
may be known, but exactly which one might not be known. Mathematically,
probability theory
formulates incomplete knowledge pertaining to the likelihood of an occurrence.
For example, a
meteorologist might say there is a 60% chance that it will rain tomorrow. This
means that in 6
of every 10 times when the world is in the current state, it will rain.
A probability is a real number between 0 and 1. In everyday speech,
probabilities are usually given
as a percentage between 0% and 100%. A probability of 100% means that an event
is certain,
whereas a probability of 0% is often taken to mean the event is impossible.
However, there is
a distinction between logically impossible and occurring with zero probability;
for example, in
selecting a number uniformly between 0 and 1, the probability of selecting 1/2
is 0, but it is
not logically impossible. Further, it is certain that whichever number is
selected will have had a
probability of 0 of being selected.
Another way of referring to probabilities is odds. The odds of an event is
defined as the ratio
of the probability that the event occurs to the probability that it does not
occur. For example,
the odds of a coin landing on a given side are ,
usually written ”1 to 1” or ”1:1”. This
,
usually written ”1 to 1” or ”1:1”. This
means that on average, the coin will land on that side as many times as it will
land on the other
side.
16.3.1 Classical Theory of Probability
1. Equally likely outcomes are outcomes which have an equal chance of happening.
For
example when a fair coin is tossed, each outcome in the sample space S = heads,
tails is
equally likely to occur.
2. When all the outcomes are equally likely (in any activity), you can
calculate the probability
of an event happening by using the following definition:
P(E)=number of favourable outcomes/total number of possible outcomes
P(E)=n(E)/n(S)
For example, when you throw a fair dice the possible outcomes are S =
{1,2,3,4,5,6} i.e
the total number of possible outcomes n(S)=6.
Event 1: get a 4
The only possible outcome is a 4, i.e E=4 i.e number of favourable outcomes: n(E)=1.
Probability of getting a 4 = P(4)=n(E)/n(S)=1/6.
Event 2: get a number greater than 3
Favourable outcomes: E = {4,5,6} Number of favourable outcomes: n(E)=3
Probability of getting a number more than 3 = P(more than 3) = n(E)/n(S)=3/6=1/2
| Worked Example 74: Classical Probability Question: Various probabilities relating to a deck of cards Answer A standard deck of cards (without jokers) has 52 cards. If we randomly draw a card from the deck, we can think of each card as a possible outcome. Therefore, there are 52 total outcomes. We can now look at various events and calculate their probabilities: 1. Out of the 52 cards, there are 13 clubs. Therefore, if the event of interest is drawing a club, there are 13 favourable outcomes, and the probability of this event is  2. There are 4 kings (one of each suit). The probability of drawing a king is  3. What is the probability of drawing a king OR a club? This example is slightly more complicated. We cannot simply add together the number of number of outcomes for each event separately (4 + 13 = 17) as this inadvertently counts one of the outcomes twice (the king of clubs). The correct answer is  . . |
Exercise: Probability Models
1. A bag contains 6 red, 3 blue, 2 green and 1 white balls. A ball is picked at
random. What is the probablity that it is:
A red
B blue or white
C not green
D not green or red?
2. A card is selected randomly from a pack of 52. What is the probability that
it
is:
A the 2 of hearts
B a red card
C a picture card
D an ace
E a number less than 4?
3. Even numbers from 2 -100 are written on cards. What is the probability of
selecting a multiple of 5, if a card is drawn at random?
16.4 Relative Frequency vs. Probability
There are two approaches to determining the probability associated with any
particular event of
a random experiment:
1. determining the total number of possible outcomes and calculating the
probability of each
outcome using the definition of probability
2. performing the experiment and calculating the relative frequency of each
outcome
Relative frequency is defined as the number of times an event happens in a
statistical experiment
divided by the number of trials conducted.
It takes a very large number of trials before the relative frequency of
obtaining a head on a toss
of a coin approaches the probability of obtaining a head on a toss of a coin.
For example, the
data in Table 16.1 represent the outcomes of repeating 100 trials of a
statistical experiment 100
times, i.e. tossing a coin 100 times.
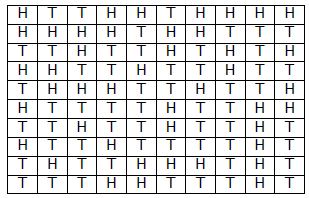
Table 16.1: Results of 100 tosses of a fair coin. H means
that the coin landed heads-up and T
means that the coin landed tails-up.
The following two worked examples show that the relative frequency of an event
is not necessarily
equal to the probability of the same event. Relative frequency should therefore
be seen as an
approximation to probability.
| Worked Example 75: Relative Frequency and
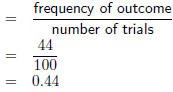
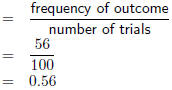
Probability Question: Determine the relative frequencies associated with each outcome of the statistical experiment detailed in Table 16.1. Answer Step 1 : Identify the different outcomes There are two unique outcomes: H and T. Step 2 : Count how many times each outcome occurs.
Step 3 : Determine the total number of trials. Probability of H Relative Frequency of T The relative frequency of the coin landing
heads-up is 0.44 and the relative frequency |
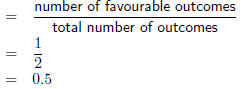
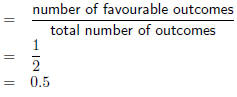
| Worked Example 76: Probability Question: Determine the probability associated with an evenly weighted coin landing on either of its faces. Answer Step 1 : Identify the different outcomes There are two unique outcomes: H and T. Step 2 : Determine the total number of outcomes. There are two possible outcomes. Step 3 : Calculate the probability of each outcome Relative Frequency of H
Relative Frequency of T
The probability of an evenly weighted coin landing on either face is 0.5. |
16.5 Project Idea
Perform an experiment to show that as the number of trials increases, the
relative frequency
approaches the probability of a coin toss. Perform 10, 20, 50, 100, 200 trials
of tossing a coin.
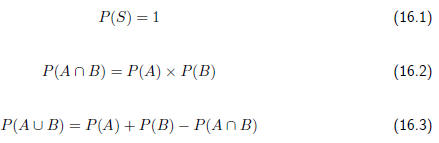
16.6 Probability Identities
The following results apply to probabilities, for the sample space S and two
events A and B,
within S.
| Worked Example 77: Probabilty identitys Question: What is the probability of selecting a black or red card from a pack of 52 cards Answer P(S)=n(E)/n(S)=52/52=1. because all cards are black or red! |
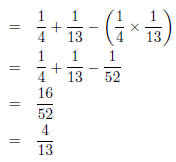
| Worked Example 78: Probabilty identitys Question: What is the probability of drawing a club or an ace with one single pick from a pack of 52 cards Answer Step 1 : Identify the identity which describes the situation P(club ∪ ace) = P(club) + P(ace) − P(club ∩ ace) Step 2 : Calculate the answer
Notice how we have used P(C ∪ A) = P(C) + P(A) − P(C ∩ A). |
Exercise: Probability Identities
Answer the following questions
1. Rory is target shooting. His probability of hitting the target is 0.7. He
fires five shots.
What is the probability that:
A All five shots miss the center?
B At least 3 shots hit the center?
2. An archer is shooting arrows at a bullseye. The probability that an arrow
hits the bullseye
is 0.4. If she fires three arrows, what is the probability that:
A All the arrows hit the bullseye,
B only one of the arrows hit the bullseye?
3. A dice with the numbers 1,3,5,7,9,11 on it is rolled. Also a fair coin is
tossed.
A Draw a sample space diagram to show all outcomes.
B What is the probability that:
i. A tail is tossed and a 9 rolled?
ii. A head is tossed and a 3 rolled?
4. Four children take a test. The probability of each one passing is as follows.
Sarah: 0.8,
Kosma: 0.5, Heather: 0.6, Wendy: 0.9. What is the probability that:
A all four pass?
B all four fail?
C at least one passes?
5. With a single pick from a pack of 52 cards what is the probability that the
card will be an
ace or a black card?
16.7 Mutually Exclusive Events
Mutually exclusive events are events, which cannot be true at the same time.
Examples of mutually exclusive events are:
1. A die landing on an even number or landing on an odd number.
2. A student passing or failing an exam
3. A tossed coin landing on heads or landing on tails
This means that if we examine the elements of the sets that make up A and B
there will be
no elements in common. Therefore, A ∩ B =  (where refers to the empty set). Since,
P(A ∩ B) = 0, equation 16.3 becomes:
P(A ∪ B) = P(A) + P(B)
for mutually exclusive events.
Exercise: Mutually Exclusive Events
Answer the following questions
1. A box contains coloured blocks. The number of each colour is given in the
following table.
| Colour | Purple | Orange | White | Pink |
| Number of blocks | 24 | 32 | 41 | 19 |
A block is selected randomly. What is the probability that
the block will be:
A purple
B purple or white
C pink and orange
D not orange?
2. A small private school has a class with children of various ages. The table
gies the number
of pupils of each age in the class.
| 3 years female | 3 years male | 4 years female | 4 years male | 5 years female | 5 years male |
| 6 | 2 | 5 | 7 | 4 | 6 |
If a pupil is selceted at random what is the probability
that the pupil will be:
A a female
B a 4 year old male
C aged 3 or 4
D aged 3 and 4
E not 5
F either 3 or female?
3. Fiona has 85 labeled discs, which are numbered from 1 to 85. If a disc is
selected at
random what is the probability that the disc number:
A ends with 5
B can be multiplied by 3
C can be multiplied by 6
D is number 65
E is not a multiple of 5
F is a multiple of 4 or 3
G is a multiple of 2 and 6
H is number 1?
16.8 Complementary Events
The probability of complementary events refers to the probability associated
with events not
occurring. For example, if P(A) = 0.25, then the probability of A not occurring
is the probability
associated with all other events in S occurring less the probability of A
occurring. This means
that
P(A′) = 1 − P(A)
where A’ refers to ‘not A’ In other words, the probability of ‘not A’ is equal
to one minus the
probability of
| Worked Example 79: Probability Question: If you throw two dice, one red and one blue, what is the probability that at least one of them will be a six? Answer Step 1 : Work out probability of event 1 To solve that kind of question, work out the probability that there will be no six. Step 2 : Work out probability of event 2 The probability that the red dice will not be a six is 5/6, and that the blue one will not be a six is also 5/6. Step 3 : Probability of neither So the probability that neither will be a six is 5/6 × 5/6 = 25/36. Step 4 : Probability of one So the probability that at least one will be a six is 1 − 25/36 = 11/36. |
| Worked Example 80: Probability Question: A bag contains three red balls, five white balls, two green balls and four blue balls: 1. Calculate the probability that a red ball will be drawn from the bag. 2. Calculate the probability that a ball which is not red will be drawn Answer Step 1 : Find event 1 Let R be the event that a red ball is drawn: • P(R)-n(R)/n(S)=3/14 • R and R’ are complementary events Step 2 : Find the probabilitys  P(R’) = 1 - P(R) = 1 -3/14 = 11/14 P(R’) = 1 - P(R) = 1 -3/14 = 11/14Step 3 : Alternate way to solve it • Alternately P(R’) = P(B) + P(W) + P(G) • P(R’) = 4/14 + 5/14 + 2/14 = 11/14 |
Extension: Interpretation of Probability Values
The probability of an event is generally represented as a real number between 0
and
1, inclusive. An impossible event has a probability of exactly 0, and a certain
event
has a probability of 1, but the converses are not always true: probability 0
events are
not always impossible, nor probability 1 events certain. The rather subtle
distinction
between ”certain” and ”probability 1” is treated at greater length in the
article on
”almost surely”.
Most probabilities that occur in practice are numbers between 0 and 1,
indicating
the event’s position on the continuum between impossibility and certainty. The
closer
an event’s probability is to 1, the more likely it is to occur.
For example, if two mutually exclusive events are assumed equally probable, such
as a flipped or spun coin landing heads-up or tails-up, we can express the
probability
of each event as ”1 in 2”, or, equivalently, ”50%” or ”1/2”.
Probabilities are equivalently expressed as odds, which is
the ratio of the proba-
bility of one event to the probability of all other events. The odds of
heads-up, for
the tossed/spun coin, are (1/2)/(1 - 1/2), which is equal to 1/1. This is
expressed
as ”1 to 1 odds” and often written ”1:1”.
Odds a:b for some event are equivalent to probability a/(a+b). For example, 1:1
odds are equivalent to probability 1/2, and 3:2 odds are equivalent to
probability
3/5.
16.9 End of Chapter Exercises
1. A group of 45 children were asked if they eat Frosties and/or Strawberry
Pops. 31 eat
both and 6 eat only Frosties. What is the probability that a child chosen at
random will
eat only Strawberry Pops?
2. In a group of 42 pupils, all but 3 had a packet of chips or a Fanta or both.
If 23 had
a packet of chips and 7 of these also had a Fanta, what is the probability that
one pupil
chosen at random has:
A Both chips and Fanta
B has only Fanta?
3. Use a Venn diagram to work out the following probabilities from a die being
rolled:
A A multiple of 5 and an odd number
B a number that is neither a multiple of 5 nor an odd number
C a number which is not a multiple of 5, but is odd.
4. A packet has yellow and pink sweets. The probability of taking out a pink
sweet is 7/12.
A What is the probability of taking out a yellow sweet
B If 44 if the sweets are yellow, how many sweets are pink?
5. In a car park with 300 cars, there are 190 Opals. What is the probability
that the first car
to leave the car park is:
A an Opal
B not an Opal
6. Tamara has 18 loose socks in a drawer. Eight of these are orange and two are
pink.
Calculate the probability that the first sock taken out at random is:
A Orange
B not orange
C pink
D not pink
E orange or pink
F not orange or pink
7. A plate contains 9 shortbread cookies, 4 ginger biscuits, 11 chocolate chip
cookies and 18
Jambos. If a biscuit is selected at random, what is the probability that:
A it is either a ginger biscuit of a Jambo?
B it is NOT a shortbread cookie.
8. 280 tickets were sold at a raffle. Ingrid bought 15 tickets. What is the
probability that
Ingrid:
A Wins the prize
B Does not win the prize?
9. The children in a nursery school were classified by
hair and eye colour. 44 had red hair
and not brown eyes, 14 had brown eyes and red hair, 5 had brown eyes but not red
hair
and 40 did not have brown eyes or red hair.
A How many children were in the school
B What is the probility that a child chosen at random has:
i. Brown eyes
ii. Red hair
C A child with brown eyes is chosen randomly. What is the probability that this
child
will have red hair
10. A jar has purple, blue and black sweets in it. The probability that a sweet,
chosen at
random, will be purple is 1/7 and the probability that it will be black is 3/5.
A If I choose a sweet at random what is the probability that it will be:
i. purple or blue
ii. Black
iii. purple
B If there are 70 sweets in the jar how many purple ones are there?
C 1/4 if the purple sweets in b) have streaks on them and rest do not. How many
purple sweets have streaks?
11. For each of the following, draw a Venn diagram to represent the situation
and find an
example to illustrate the situation.
A A sample space in which there are two events that are not mutually exclusive
B A sample space in which there are two events that are complementary.
12. Use a Venn diagram to prove that the probability of either event A or B
occuring is given
by: (A and B are not exclusive)
P(A or B) = P(A) + P(B) - P(A and B)
13. All the clubs are taken out of a pack of cards. The remaining cards are then
shuffled and
one card chosen. After being chosen, the card is replaced before the next card
is chosen.
A What is the sample space?
B Find a set to represent the event, P, of drawing a picture card.
C Find a set for the event, N, of drawing a numbered card.
D Represent the above events in a Venn diagram
E What description of the sets P and N is suitable? (Hint: Find any elements of
P in
N and N in P.)
14. Thuli has a bag containing five orange, three purple and seven pink blocks.
The bag
is shaken and a block is withdrawn. The colour of the block is noted and the
block is
replaced.
A What is the sample space for this experiment?
B What is the set describing the event of drawing a pink block, P?
C Write down a set, O or B, to represent the event of drawing either a orange or
a
purple block.
D Draw a Venn diagram to show the above information.