

Absolute Value Inequalities
In the last section, we solved absolute value equations. In this section, we
turn our
attention to inequalities involving absolute value.
Solving |x| < a
The solutions of
|x| < a
again depend upon the value and sign of the number a. To solve |x| < a
graphically,
we must determine where the graph of the left-hand side lies below the graph of
the
right-hand side of the inequality |x| < a. There are three cases to consider.
• Case I: a < 0
In this case, the graph of y = a lies strictly below the x-axis. As you can see
in
Figure 1(a), the graph of y = |x| never lies below the graph of y = a.
Hence, the
inequality |x| < a has no solutions.
• Case II: a = 0
In this case, the graph of y = 0 coincides with the x-axis. As you can see in
Figure 1(b), the graph of y = |x| never lies strictly below the x-axis.
Hence, the
inequality |x| < 0 has no solutions.
• Case III: a > 0
In this case, the graph of y = a lies strictly above the x-axis. In Figure 1(c),
the
graph of y = |x| and y = a intersect at x = −a and x = a. In Figure 1(c),
we
also see that the graph of y = |x| lies strictly below the graph of y = a when x
is
in-between −a and a; that is, when −a < x < a.
In Figure 1(c), we’ve dropped dashed vertical lines from the points of
intersection
of the two graphs to the x-axis. On the x-axis, we’ve shaded the solution of
|x| < a, that is, −a < x < a.
Figure 1. The solution of |x| < a has three cases.
This discussion leads to the following key property.
| Property 1. The solution of |x| < a
depends upon the value and sign of a. • Case I: a < 0 The inequality |x| < a has no solution. • Case II: a = 0 The inequality |x| < 0 has no solution. • Case III: a > 0 The inequality |x| < a has solution set {x : −a < x < a}. |
Let’s look at some examples.
 Example 2. Solve the inequality |x| <
−5 for x.
Example 2. Solve the inequality |x| <
−5 for x.
The graph of the left-hand side of |x| < −5 is the “V” of Figure 1(a). The graph
of the right-hand side of |x| < −5 is a horizontal line located 5 units below
the x-axis.
This is the situation shown in Figure 1(a). The graph of y = |x| is therefore
never
below the graph of y = −5. Thus, the inequality |x| < −5 has no solution.
An alternate approach is to consider the fact that the absolute value of x is
always
nonnegative and can never be less than −5. Thus, the inequality |x| < −5 has no
solution.
Example 3. Solve the
inequality |x| < 0 for x.
This is the case shown in Figure 1(b). The graph of y = |x| is never strictly
below
the x-axis. Thus, the inequality |x| < 0 has no solution.
Example 4. Solve the
inequality |x| < 8 for x.
The graph of the left-hand side of |x| < 8 is the “V” of Figure 1(c). The graph
of
the right-hand side of |x| < 8 is a horizontal line located 8 units above the
x-axis. This
is the situation depicted in Figure 1(c). The graphs intersect at (−8, 8) and
(8, 8) and
the graph of y = |x| lies strictly below the graph of y = 8 for values of x
in-between
−8 and 8. Thus, the solution of |x| < 8 is −8 < x < 8.
It helps the intuition if you check the results of the last example. Note that
numbers
between −8 and 8, such as −7.75, −3 and 6.8 satisfy the inequality,
| − 7.75| < 8 and | − 3| < 8 and |6.8| < 8,
while values that do not lie between −8 and 8 do not
satisfy the inequality. For example,
none of the numbers −9.3, 8.2, and 11.7 lie between −8 and 8, and each of the
following
is a false statement.
| − 9.3| < 8 and |8.2| < 8 and |11.7| < 8 (all are false)
If you reflect upon these results, they will help cement the notion that the
solution of
|x| < 8 is all values of x satisfying −8 < x < 8.
Example 5. Solve the
inequality |5 − 2x| < −3 for x.
If the inequality were |x| < −3, we would not hesitate. This is the situation
depicted
in Figure 1(a) and the inequality |x| < −3 has no solutions. The reasoning
applied
to |x| < −3 works equally well for the inequality |5 − 2x| < −3. The left-hand
side of
this inequality must be nonnegative, so its graph must lie on or above the
x-axis. The
right-hand side of |5 − 2x| < −3 is a horizontal line located 3 units below the
x-axis.
Therefore, the graph of y = |5 − 2x| can never lie below the graph of y = −3 and
the
inequality |5 − 2x| < −3 has no solution.
We can verify this result with the graphing calculator. Load the left- and
right-hand
sides of |5−2x| < −3 into Y1 and Y2, respectively, as shown in
Figure 2(a). From
the
ZOOM menu, select 6:ZStandard to produce the image shown in Figure 2(b).
As predicted, the graph of y = |5−2x| never lies below the graph of y = −3, so
the
inequality |5 − 2x| < −3 has no solution.
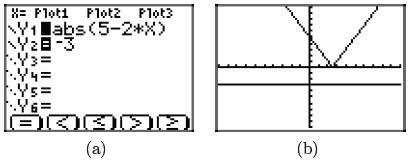
Figure 2. Using the graphing calculator to solve the
inequality
|5 − 2x| < −3.
![]() Example 6.
Solve the inequality |5 − 2x| < 0 for x.
Example 6.
Solve the inequality |5 − 2x| < 0 for x.
We know that the left-hand side of the inequality |5 − 2x| < 0 has the “V” shape
indicated in Figure 1(b). The graph “touches” the x-axis when |5 − 2x| = 0, or
when

However, the graph of y = |5 − 2x| never falls below the
x-axis, so the inequality
|5 − 2x| < 0 has no solution.
Intuitively, it should be clear that the inequality |5−2x|
< 0 has no solution. Indeed,
the left-hand side of this inequality is always nonnegative, and can never be
strictly
less than zero.
![]() Example 7.
Solve the inequality |5 − 2x| < 3 for x.
Example 7.
Solve the inequality |5 − 2x| < 3 for x.
In this example, the graph of the right-hand side of the inequality |5 − 2x| < 3
is a
horizontal line located 3 units above the x-axis. The graph of the left-hand
side of the
inequality has the “V” shape shown in Figure 3(b) and (c). You can use the
intersect
utility on the graphing calculator to find the points of intersection of the
graphs of
y = |5 − 2x| and y = 3, as we have done in Figures 3(b) and (c). Note that the
calculator indicates two points of intersection, one at x = 1 and a second at x
= 4.
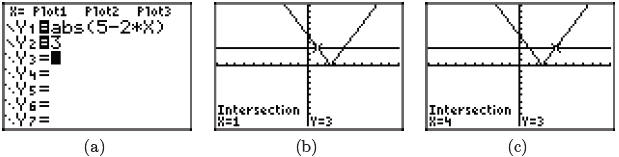
Figure 3. Using the graphing calculator to solve the
inequality |5 − 2x| < 3.
The graph of y = |5 − 2x| falls below the graph of y = 3 for all values of x
between 1
and 4. Hence, the solution of the inequality |5 − 2x| < 3 is the set of all x
satisfying
1 < x < 4; i.e. {x : 1 < x < 4}.
| Expectations. We need a way of summarizing this
graphing calculator approach on our homework paper. First, draw a reasonable facsimile of your calculator’s viewing window on your homework paper. Use a ruler to draw all lines. Complete the following checklist. • Label each axis, in this case with x and y. • Scale each axis. To do this, press the WINDOW button on your calculator, then report the values of xmin, xmax, ymin, and ymax on the appropriate axis. • Label each graph with its equation. • Drop dashed vertical lines from the points of intersection to the x-axis. Shade and label the solution set of the inequality on the x-axis. |
Following the guidelines in the above checklist, we obtain the image in Figure 4.
Figure 4. Reporting a graphical solution of
|5 − 2x| < 3.
Algebraic Approach. Let’s now explore an algebraic solution of the inequality
|5 − 2x| < 3. Much as |x| < 3 implies that −3 < x < 3, the inequality
|5 − 2x| < 3
requires that
−3 < 5 − 2x < 3.
We can subtract 5 from all three members of this last inequality, then simplify.
−3 − 5 < 5 − 2x − 5 < 3 − 5
−8 < −2x < −2
Divide all three members of this last inequality by −2, reversing the inequality
symbols
as you go.
4 > x > 1
We prefer that our inequalities read from “small-to-large,” so we write
1 < x < 4.
This form matches the order of the shaded solution on the number line in Figure
4,
which we found using the graphing calculator.
The algebraic technique of this last example leads us to the following property.
| Property 8. If a > 0, then the inequality
|x| < a is equivalent to the inequality −a < x < a. |
This property provides a simple method for solving
inequalities of the form |x| < a.
Let’s apply this algebraic technique in the next example.
![]() Example 9. Solve the inequality |4x + 5| < 7 for x.
Example 9. Solve the inequality |4x + 5| < 7 for x.
The first step is to use Property 8 to write that
|4x + 5| < 7
is equivalent to the inequality
−7 < 4x + 5 < 7.
From here, we can solve for x by first subtracting 5 from all three members,
then
dividing through by 4.
We can sketch the solution on a number line.
And we can describe the solution in both interval and set-builder notation as follows.
Assuming that a > 0, the inequality |x| ≤ a requires that
we find where the absolute
value of x is either “less than” a or “equal to” a. We know that |x| < a when −a
< x < a
and we know that |x| = a when x = −a or x = a. Thus, the solution of |x| ≤ a is
the
“union” of these two solutions.
This argument leads to the following property.
![]() Example 11. Solve the inequality 5 − 3|x − 4| ≥ −4 for x.
Example 11. Solve the inequality 5 − 3|x − 4| ≥ −4 for x.
At first glance, the inequality
5 − 3|x − 4| ≥ −4
has a form quite dissimilar from what we’ve done thus far. However, let’s
subtract 5
from both sides of the inequality.
−3|x − 4| ≥ −9
Now, let’s divide both sides of this last inequality by
−3, reversing the inequality sign.
|x − 4| ≤ 3
Aha! Familiar ground. Using Property 10, this last inequality is equivalent to
−3 ≤ x − 4 ≤ 3,
and when we add 4 to all three members, we have the solution.
1 ≤ x ≤ 7
We can sketch the solution on a number line.
And we can describe the solution with interval and
set-builder notation.
[1, 7] = {x : 1 ≤ x ≤ 7}
Solving |x| > a
The solutions of |x| > a again depend upon the value and sign of a. To solve |x|
> a
graphically, we must determine where the graph of y = |x| lies above the graph
of
y = a. Again, we consider three cases.
• Case I: a < 0
In this case, the graph of y = a lies strictly below the x-axis. Therefore, the
graph
of y = |x| in Figure 5(a) always lies above the graph of y = a. Hence, all real
numbers are solutions of the inequality |x| > a.
• Case II: a = 0
In this case, the graph of y = 0 coincides with the x-axis. As shown in Figure
5(b),
the graph of y = |x| will lie strictly above the graph of y = 0 for all values
of x
with one exception, namely, x cannot equal zero. Hence, every real number except
x = 0 is a solution of |x| > 0. In Figure 5(b), we’ve shaded the solution of |x|
> 0,
namely the set of all real numbers except x = 0.
• Case III: a > 0
In this case, the graph of y = a lies strictly above the x-axis. In Figure 5(c),
the
graph of y = |x| intersects the graph of y = a at x = −a and x = a. In Figure
5(c),
we see that the graph of y = |x| lies strictly above the graph of y = a if x is
less
than −a or greater than a.
In Figure 5(c), we’ve dropped dashed vertical lines from the points of
intersection
to the x-axis. On the x-axis, we’ve shaded the solution of |x| > a, namely the
set of all real numbers x such that x < −a or x > a.
Figure 5. The solution of |x| > a has three cases.
This discussion leads to the following property.
| Property 12. The solution of |x| > a
depends upon the value and sign of a. • Case I: a < 0 All real numbers are solutions of the inequality |x| > a. • Case II: a = 0 All real numbers, with the exception of x = 0, are solutions of |x| > 0. • Case III: a > 0 The inequality |x| > a has solution set {x : x < −a or x > a}. |