
Math Graphic Organizer Guide
Using Graphics Organizers
√ to Support Math Progress
√ to Clarify Math for the Targeted Instructional Area: Writing to Learn.
| First Semester Schedule
Session 1: October 22, 2:00-2:40 pm Session 2: November 12, 1:20-2:00 |
Why graphic organizers?
Why writing?
What works?
Graphic Organizers increase learning.
As a tool to support students’ thinking and learning processes, the 29
research studies have shown that graphic organizers help students:
• brainstorm ideas.
• develop, organize, and communicate ideas.
• see connections, patterns, and relationships.
• assess and share prior knowledge.
• develop vocabulary.
• highlight important ideas.
• classify or categorize concepts, ideas, and information.
• improve social interaction between students, and facilitate group work and
collaboration.
• guide review and study.
Graphic organizers have been found to improve students’
reading
comprehension at all levels, first grade through high school. …NRP (National
Reading Panel) cited graphic and semantic organizers (including story maps)
as one of seven categories of instruction that is the most effective in
improving reading comprehension.
Source: Institute for the Advancement of Research in Education, July 2003
  |
Critical Thinking | |
| Writing develops | Comprehension | |
| Content Learning |
There is clear evidence that activities involving writing
(any of the many sorts of
writing) lead to better learning than activities involving reading and studying
only. To
improve the teaching of writing is also to improve the quality of thinking
required of
students....
Source: How Writing Shapes Thinking
My Plan
To use graphic organizers as models/guides…
For students to create their own graphic organizers…
For students to write to clarify what they learn…
A message about the first day of teaching.
Source: A website dedicated to teachers helping teachers.
The following plea for help has come from a newly
appointed teacher who wishes to
remain anonymous.
On the first day of my teaching career, I defined a
rational number to my
class as a number that can be expressed as a ratio of integers. A
student asked me: What exactly are ratios? How do ratios differ from fractions?
I gave some answers that I was not satisfied with. So, I consulted some other
teachers and texts. The result was confusion.
I find that opinions and texts vary about the definitions
of these terms. Please
tell me how ratios, rational numbers and fractions should be defined to make
their distinguishing properties meaningful to the high school students.
To convince you why it is confusing, I am giving below a sample of definitions
of
ratios and fractions from different texts.
'A comparison of two quantities by division is a ratio.'
'A fraction is a comparison of two numbers. Another word for the
comparison of two numbers is ratio.'
'A ratio is the comparison of two quantities that have the same units.'
'A ratio of two quantities is their quotient. For example, the ratio
of 3 oranges to 5 oranges is 3/5.'
'A ratio is a comparison of two quantities, usually expressed as a
fraction. In fact, a fraction is frequently called a 'rational number,' because
one meaning of the word rational is 'having to do with ratios'.'
'An indicated quotient of two numbers is often called a ratio.'
'For any two positive numbers, a and b, the ratio of a to b is a/b.
This is sometimes written as a : b.'
'Any fraction may be considered as a ratio of its numerator to its
denominator.'"
The website included some recommendations. One teacher
suggested a word chart.
How could such a graphic organizer help this teacher’s students get and stay
clear?
| Term | Explanation | Example |
Quantitative Reasoning: Analyze Patterns
Title: _______________________________________________________________
? Explain what the graph shows.
BAR GRAPH
Title of the Graph
Analysis of the Graph
LINE GRAPH
Use quantitative information about something that changes over time.
1. Locate and collect information about a situation that changes over time.
2. Use that information to make a line graph.
Title of the Graph
Analysis of the Graph
GRAPH PROPORTIONS
1. Locate and collect information about a topic or
situation.
Topic/Situation: ______________________________________________
2. Use that information to make a circle graph.
Title of the Graph
Key:
Analysis of the Graph
Show Differences and Similarities
Title: _______________________________________________
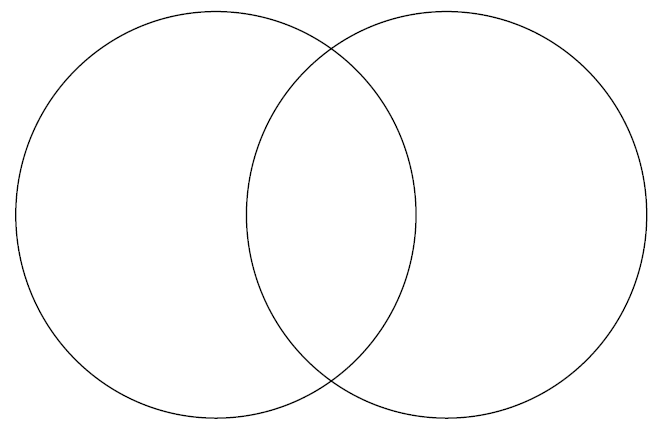
Explain what your Venn diagram shows.
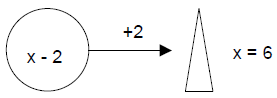
Show How You Solved the Math Problem
Step 1. What is the problem—what are you going to determine?
Step 2. How will you do it? What strategy will you use to solve the problem?
Step 3. What information will you use to solve it?
Step 4. What do you estimate the answer will be? ____________
Solve it here. Show your work.
What is your answer? ________________________
How and why did it differ from your estimate?
_________________________________
_____________________________________________________________________
Major Question:
How do you …
Answer with:
Graphic Example
+ Written annotations
Teachers’ Models
How do you
Clemente Teachers’ Math Strategies Using Graphic Organizers
• Many organizers can be used with geometry or math. It’s all about ideas/creativity.
• In math we use charts, tables, graphs, Venn diagrams and
many forms of time lines
to organize material or solve problems.
• Chart and Venn diagram can be used to compare different
types of numbers in
algebra.
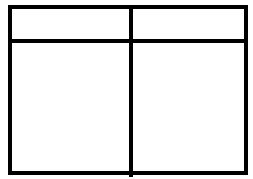
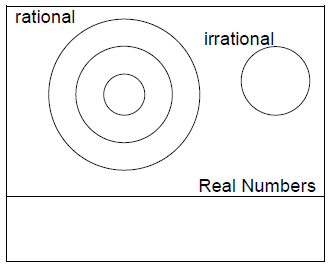
• I use a Venn diagram to categorize real numbers. Charts
work well in geometry. (A
word column, definition column, simple definition column, and picture or example
column.)
• I use charts to introduce new words, and outlines to show the steps of a problem.
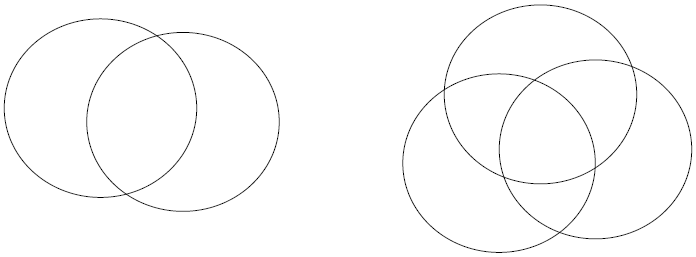
• Students will be given a math article, they will be
asked to find words that are
exclusively math words and to write those words in the left circle (not in the
intersection
part). Similarly they will write exclusively non-math words in the right circle
and the
words that can be used commonly in math and non math areas in the intersection
part.
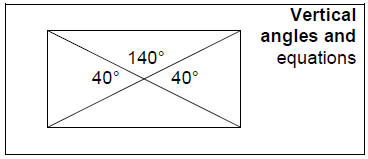
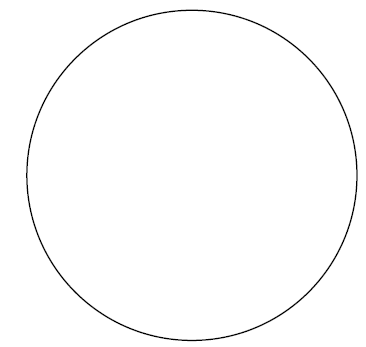
• I use the circle to teach angles in my geometry class.
They learn:
o How to use a protractor
o How to read a protractor
o Acute, obtuse and right angles
o x and y axis
o quadrants
o Negative-positive numbers.
o
• I use the chart to compare/change fractions to decimals, etc.
• Use a Venn diagram to compare and contrast (similarities
and differences of
shapes/measures of different types of angles.)